Here’s what’s actually stacking up there, how that’s changed over time, and what’s genuinely worth doing about it. For the full pixel-height dataset by tracker and period, see how much SERP space do AI Overviews take up.
What’s competing for the space above your listing
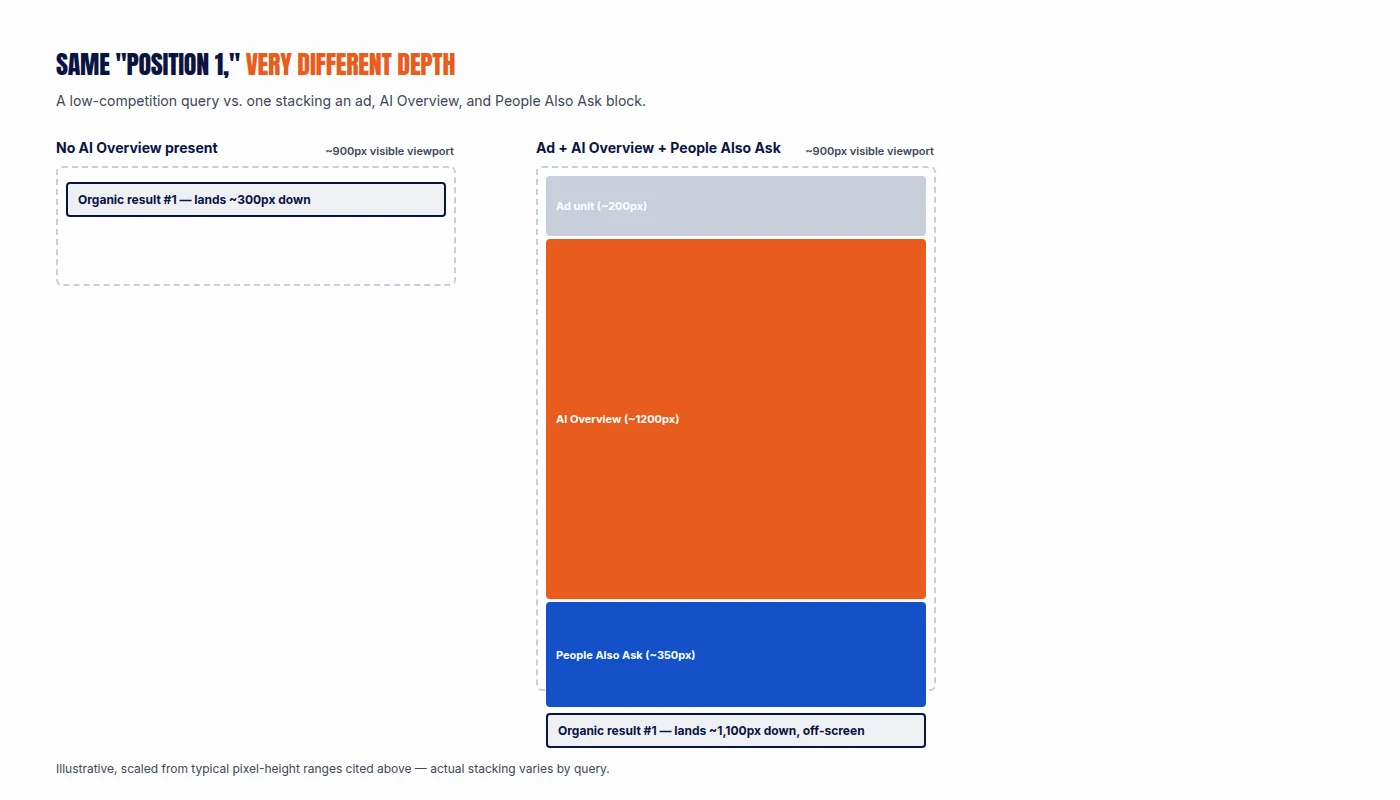
A modern SERP can layer several features before a single organic result appears. Google Ads typically run 150 to 250 pixels tall at the top. An AI Overview, when present, can add anywhere from roughly 500 pixels to over 1,200 depending on query complexity and tracking source. A People Also Ask accordion can add another 300 to 400 pixels if expanded. Featured snippets, local packs, and video carousels can each add more, depending on the query.
Add those together on a competitive query and it’s easy to see how a “position 1” organic listing ends up nowhere near the top of the visible page.
The pixel growth trend
Every tracker measures this a little differently, so treat any single number as directional rather than universal. BrightEdge’s ongoing tracking found AI Overviews averaging over 1,200 pixels tall on desktop by February 2026, up 15% year-over-year and peaking around 1,340 pixels in December 2025, a substantial jump from their roughly 600-pixel footprint at the May 2024 launch. SeoClarity’s separate tracking puts desktop AI Overviews at an average of 1,110 pixels versus 617 pixels on mobile. Other trackers report a narrower 500 to 700 pixel range depending on their sampling and time window.
The variation comes from real differences in what’s being measured: different query sets, different points in time, and AI Overview length itself varies enormously depending on the complexity of the question being answered. What’s consistent across every source is the direction. AI Overviews have gotten larger since launch, not smaller, and they show no sign of that trend reversing.
Why this matters more than your rank number
Two pages can both hold “position 1” in the traditional, ordinal sense and occupy wildly different actual screen depth, depending entirely on what’s stacked above them on that specific query. A #1 ranking on a low-competition query with no AI Overview might sit 300 pixels down the page. A #1 ranking on a query with a large AI Overview, an ad, and a People Also Ask block might sit 1,100 pixels down, entirely off-screen on a standard monitor without scrolling.
That gap is invisible to traditional rank tracking, which only counts ordinal position among organic results. It’s the reason two pages holding identical positions can see meaningfully different real-world traffic, a pattern explored further in can you rank #1 and still lose traffic to AI Overviews. This is what pixel rank, sometimes called Visual Rank, was built to capture: the actual vertical distance from the top of the page to your result, accounting for everything stacked above it. Tools including seoClarity, Advanced Web Ranking, and DemandSphere now offer this as a standing metric rather than a one-off audit. That same concept, applied at the keyword-set level rather than per-query, is what AI Overview occupancy measures.
Mobile makes it worse
The effect compounds on mobile, where most search happens. A smaller screen means the same absolute pixel height consumes a larger share of what’s actually visible without scrolling. SeoClarity’s data showing desktop AI Overviews averaging 1,110 pixels against 617 pixels on mobile might look like mobile is less affected, but that comparison misses the point: 617 pixels on a phone screen that’s only 800 or so pixels tall to begin with consumes a much larger proportion of the visible viewport than 1,110 pixels does on a desktop monitor several times that height.
What Google has done about it
To Google’s credit, this hasn’t gone unacknowledged. On May 6, 2026, Google announced five updates to AI Overviews and AI Mode aimed specifically at sending more traffic back to the sites the summaries draw from, following widely reported CTR declines and mounting pressure from publishers and regulators.
The most notable addition is Further Exploration, a section that appears at the end of an AI Overview with curated links to related articles, case studies, and reports not already covered in the summary itself. Google also added inline links placed next to the specific text they support rather than grouped at the bottom, hover previews that show source details before a click, subscription labels for publications a user already subscribes to, and a section surfacing firsthand perspectives from forums and social discussions with clickable attribution.
These are genuine, if partial, countermeasures. They add click opportunities without reducing the AI Overview’s footprint on the page. The pixel problem and the click-opportunity problem are related but distinct, and Google’s changes address the second more directly than the first.
What site owners can actually do
You can’t shrink Google’s AI Overview or reclaim the pixels above your listing directly. That’s not a lever available to any individual site. The more useful move is redirecting effort toward what’s actually controllable.
Winning the AI Overview citation itself is the single best way to gain visibility within the crowded space rather than being pushed below it. A cited brand appears inside the dominant element on the page, not competing against it for the scraps of attention left over.
Tracking pixel depth or visual rank alongside ordinal ranking gives a far more accurate read on real visibility than rank position alone, and it explains traffic patterns that pure rank tracking can’t account for.
And building traffic channels that don’t depend on organic SERP real estate at all, direct traffic, email, brand search, and citation across other AI engines beyond Google, reduces how much any single SERP’s pixel economics can affect your business overall.
FAQ
How much space do AI Overviews take up on the search results page?
Measurements vary by query and tracker, but current data shows AI Overviews averaging over 1,200 pixels tall on desktop when present by some tracking, up from roughly 600 pixels at their 2024 launch. That’s often enough on its own to push the first organic result below the initial visible screen.
Is this effect worse on mobile than desktop?
Generally yes. While the absolute pixel height of an AI Overview tends to be somewhat smaller on mobile, it consumes a much larger share of a phone’s shorter screen than the same relative size does on a desktop monitor, pushing organic results down further relative to what’s actually visible without scrolling.
Is there a way to track how far down my listing actually appears, not just its rank number?
Yes. This is called pixel rank or Visual Rank, a metric offered by several enterprise SEO platforms, including seoClarity, Advanced Web Ranking, and DemandSphere, that measures the actual pixel depth of a result rather than its ordinal position, giving a more accurate picture of real visibility.
Has Google done anything to address the click-loss problem this creates?
Yes, partially. In May 2026, Google added several link-focused features to AI Overviews and AI Mode, including a “Further Exploration” section with curated related links, inline links placed next to supporting text, and hover previews. These increase click opportunities within an AI Overview but don’t reduce its footprint on the page.